Throughout the emergence and continued spread of the novel coronavirus, COVID-19, policy makers across the world are relying on panels of scientific advisors to help guide them on the most appropriate interventions to make in order to protect the largest proportion of the population from the disease.
Such interventions fall into two main groups. The first group is Pharmaceutical Interventions (PIs), which Sarah Kostiuk-Smith has examined in more detail in her recent blog post here. The second group is Non-pharmaceutical Interventions (NPIs), which includes:
- isolating people who are known or are suspected to have the virus;
- quarantining entire households where one or more members of that household are known or are suspected to have the virus;
- banning mass gatherings and public events;
- closing schools, universities and places of work; and
- wide-scale social distancing, including local and national lockdowns
As we in the UK are all too aware, the UK government is currently implementing a combination of all of the above NPIs in one form or other to try to limit the spread of the virus. This group of NPIs is being termed a “lock down”, whereby all UK residents are being asked to stay at home unless it is absolutely necessary to leave the house.
Throughout this pandemic, the UK government is being guided by the Scientific Advisory Group for Emergencies (SAGE), who provide advice to the government based on scientific evidence. However, how do SAGE (and equivalent political advisory bodies around the world) predict how the virus will spread and, hence, how best to advise the government? The answer to this question lies in computer modelling and simulation.
In this blog post, I will briefly examine how computer modelling is being used to predict the impact that different NPIs will have on controlling the spread of the virus, and hence how modelling is being used to influence the difficult decisions the government are having to make at the moment.
For a look at how computational biology is being used during the COVID-19 pandemic please see Camille Terfve’s blog post here.
How has computer modelling been applied to COVID-19?
A computer-based model is a computer program made up of an abstract mathematical representation of a real-world system. When run, the model is designed to simulate what might happen in “real-life”. Such a model is built from a number of logical constants and variables, and needs to be populated with real-life data in order to be able to simulate “real-life” accurately.
Computer simulations are being used extensively in the fight against COVID-19. In particular, they are being used to predict how the virus may spread (both geographically and temporally) amongst populations of people and how different interventions may affect how the disease spreads. They are hence being used to inform decision makers as to what to expect over the coming weeks and months and what sort of NPIs should be put in place to best manage the outbreak.
One of the most common ways of modelling the transmission of infectious disease is with a “compartmental model”. This is where the population in question (e.g. the UK) is divided into multiple “compartments”. The “SEIR model” is a variation of a basic compartmental model that can be applied to COVID-19, where:
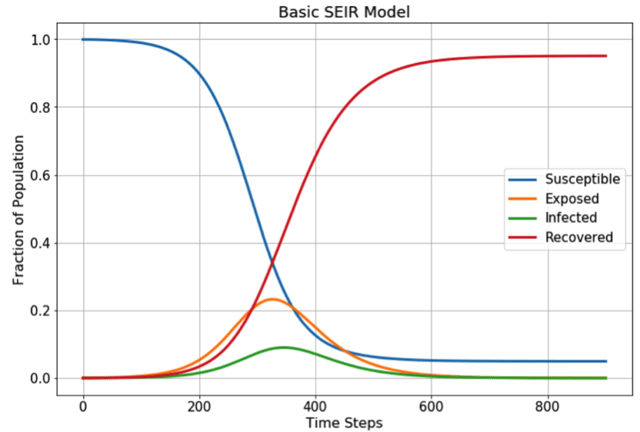
- “S” (shown in blue on the graph below) is the number of individuals in the population who are susceptible to catching the virus. As illustrated on the graph below, at the emergence of the disease almost the entire population belongs to the “S” compartment;
- “E” (shown in orange on the graph below) is the number of individuals in the population who are exposed to the disease;
- “I” (shown in green on the graph below) is the number of individuals in the population who become infected by the disease; and
- “R” (shown in red on the graph below) is the number of individuals in the population who are resistant to the disease, either by recovering from the disease or by being vaccinated.
Applying a basic SEIR model to a population produces a trend similar to the following graph:
Source: Towards Data Science
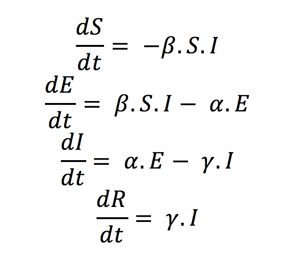
This trend is created using the following first-order differential equations to predict how a disease such as COVID-19 will propagate through a population over time (t):
Source: Towards Data Science
where:
- “α” is the inverse of the incubation period (in days). The incubation period is the time between the individual being exposed to the virus and beginning to show symptoms. Most estimates of the incubation period for COVID-19 range from 1-14 days
- “β” is the average contact rate, which is the average number of contacts per person per day, multiplied by the probability of disease transmission between someone in the “I” compartment and someone in the “S” compartment.
- “γ” is the inverse of the mean infectious period (in days), which is the mean time that a person in the “I” compartment is infected for.
It is worth highlighting here that the ratio of “β” to “γ” produces the R0 value which you may have heard mentioned on the news. This is the Basic Reproduction Number of the disease and is an approximation of how many people are infected by a single person with the disease. Depending on the population, COVID-19 is estimated to have an R0 value of between 2 and 3, meaning that without intervention, every person who has COVID-19 will go on to infect 2 to 3 more people.
The parameters of the above differential equations are calculated using real-life data collected by hospitals and other health care providers. In order for the model to provide accurate predictions, it is therefore necessary to test and monitor large swathes of the population to determine which compartment they occupy at a particular point in time. Researchers at Johns Hopkins University are doing an amazing job of collating all of the data collected from around the word.
Modelling the impact that different NPIs have on COVID-19 transmission
The compartmental model discussed above may also be used to examine how various NPIs influence how COVID-19 will spread.
For example, to examine how social distancing effects disease transmission over time, a fourth parameter called the “social distancing factor (ρ)” can be incorporated into the above equations as follows:
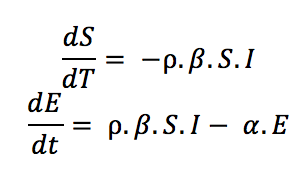
Source: Towards Data Science
As we can see from the graph below, increasing the amount of social distancing in a population (a lower ρ value represents a higher level of social distancing), effectively “flattens the curve”.
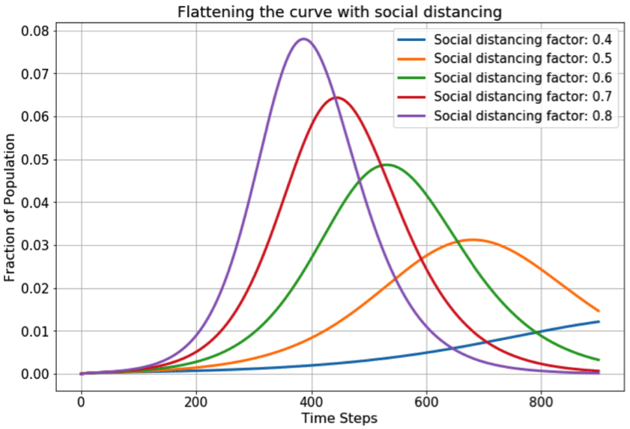
Source: Towards Data Science
Whilst it seems fairly intuitive that reducing contact with other people will limit the spread of COVD-19, it is unrealistic to ask the public to keep away from each other for the entire lifespan of the virus. Therefore, by modelling different scenarios, researchers are able to predict how different levels of social distancing will affect the transmission characteristics of COVID-19. This will help to guide governmental decisions and the advice given to the public.
A further simulation as to how social distancing works to slow the spread of the disease was included in the Washington Post here (this is worth looking at, it’s really cool!)
By carrying out similar simulations for various NPIs, researchers are also able to identify which NPI, or combination of NPIs, has the biggest impact on the progression of the disease and hence has the ability to protect the largest proportion of the population.
Such studies have been carried out by a team of researchers at Imperial College London, who looked at how different NPIs influence the proportion of the population that would end up needing a critical care bed due to the symptoms of COVID-19.
Carrying out computer simulations such as this allows the government to implement strategies that will hopefully prevent the NHS, and critical care facilities in particular, from being overwhelmed throughout the outbreak.
Using modelling to determine an “exit strategy”
Computer modelling is further being used during this pandemic to predict the most appropriate way of easing the restrictions discussed above so as to provide guidance for formulating a so called “exit strategy”.
One such strategy also being investigated by Imperial College London is shown in the graph below and involves “adaptive triggering” of NPIs. This is where NPIs, such as social distancing, are eased until the number of people needing intensive care treatment due to COVID-19 symptoms reaches an upper threshold. At this point the NPIs are brought back into force until the number of people needing intensive care treatment reaches a lower threshold, when the NPIs will be lifted again.
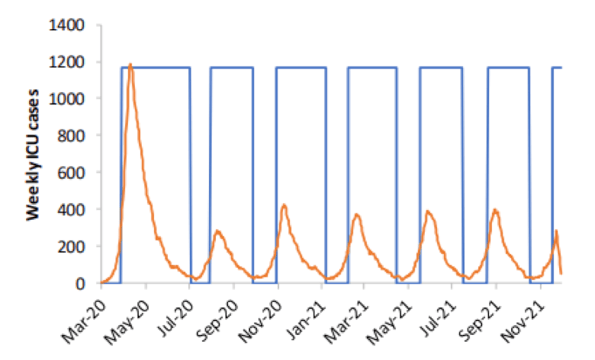
Source: Imperial College
Of course, this is just one NPI strategy out of many that are being researched and it is likely that the government will choose to adopt a combination of several NPIs and PIs in the coming weeks and months. However, one thing for sure is that computer modelling of COVID-19 has the potential to have a massive impact on the eventual outcome of this disease and will carry on influencing the decisions that the government makes as we continue to do battle.
This blog was written by Anna King.